Jahson Ratandi 29453836
Introduction
Who is Robert Hooke?

Robert Hooke was born on July 1635 and died on March 1703. His fields of studies ranged from physics, astronomy, biology to chemistry.
He was highly recognised for his work and findings on “Hooke’s Law of Elasticity” and his microscopic observations. Also recognised as being a surveyor for his work in 1666 London after the “Great fire”, where he participated in the redesigning of public buildings and streets.
Hooke was well renown for his scientific methods during his demonstrations, experiments and observations. He published two publications which have credited him since 1703. His first publication was “Micrographia”, a well documented publication which he used a microscope to examine and detail different materials and animals. His second publication was his theory of elasticity, which later became “Hooke’s Law”.
Method
An experiment is to be done to determine the behaviour of three materials (y1, y2 and z), in relation to Hooke’s law. Two of the materials within their elastic regions and one in it’s plastic region.
The results will then be recorded, analysed and after interpreted. This will help to determine what is happening physically and identify the differences between the materials.
The items required for a Hooke’s law experiment:

- Set up the apparatus.
- The spring is fixed at one end of the clamp with a known mass(force) attached, parallel with the ruler.
- It’s displaced length is measured and recorded.
- Repeat the test a few times and increase the mass applied.
Hooke’s Law

Robert Hooke investigated how springs and elastic materials stretch. “Hooke’s Law” states that the force needed to compress or extend a spring is directly proportional to the distance you stretch it. In other words, the more a material is stretched, the harder it becomes to keep stretching the same material. In graphical terms it is a linear relationship.
As an equation, it can be written as: F = -kx
where F is the force applied to the spring (N).
where x is the displacement of the spring (m).
where k is the spring constant, the rate at which the spring is displaced (N/m).
Hooke’s law applies, as long as the material is within it’s elastic limit.
Once a sufficient amount of force has been applied, so as to extend the material beyond it’s elastic limit, the material enters it’s plastic region. With the material in it’s plastic region, the force applied causes permanent displacement of the material.
Results
| X | Y1 | Y2 | Z |
| 1 | 3.00 | 2.26 | 2.375 |
| 2 | 4.50 | 4.32 | 9.375 |
| 3 | 6.00 | 6.37 | 28.375 |
| 4 | 7.50 | 8.43 | 65.375 |
| 5 | 9.00 | 10.49 | 126.375 |
| 6 | 10.50 | 12.55 | 217.375 |
| 7 | 13.00 | 14.61 | 344.375 |
| 8 | 14.00 | 16.67 | 513.375 |
| 9 | 15.00 | 18.72 | 730.375 |
The results of the experiment plotted on graphs with trend lines showing y1 against y2:
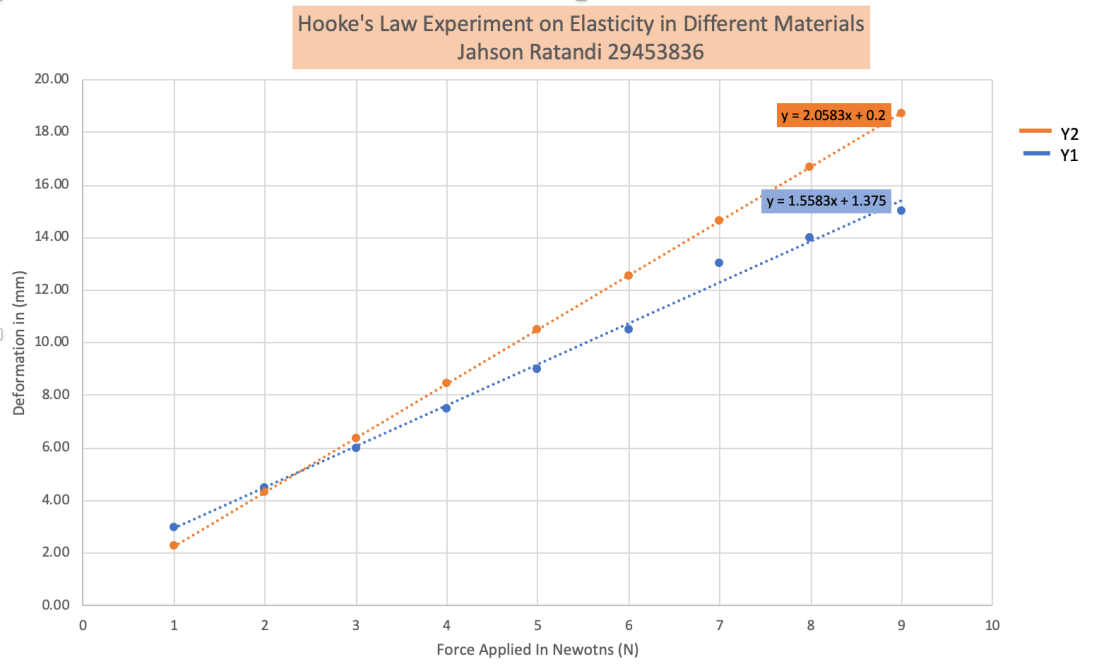
The estimated intersecting point is 2.35. This was calculated by using simultaneous equations, as shown below: 
Graph showing Z against X:

Conclusion
The results obtained from this experiment show that Hooke’s law is true.
Materials 1 and 2, whose displacement is shown in the results as y1 and y2, respectively, are in their elastic region. As such, a linear relationship between the force applied (x) and their displacement (y) is shown in Fig 1.
This indicates that as force is applied, the material is displaced directly proportionally.
Material 3 as shown in the results on graph Fig 2, is indicated to be in it’s plastic region. The trend line shows that as force is applied, the material is displaced permanently.
The steeper trend line in the graph for material 2, shows that less force is required to result in a greater displacement of the material than for material 1, indicating that it is more elastic.
A comparison of the graphs shows that for material 3 a far greater amount of force is required than for materials 1 or 2 to achieve any displacement.
Though the data appears to represent the physical results of the experiment, there are a number of possible errors:
- User error when reading the measurements from the ruler, reading the measurements from an angle.
- The ruler used may not have been accurate.
- Mass used may not have been exact.
- When resolving the simultaneous equations, the values were rounded to four decimal places this could have produced a slight error in the final results of the calculation as they wouldn’t have been very precise.
If the experiment was to be conducted again, these possible errors would have to be minimised.
References
“I am aware of the requirements of good academic practice and the potential penalties for any breaches”.
Biography. (2018). Robert Hooke. [online] Available at: https://www.biography.com/people/robert-hooke-9343172 [Accessed 10 Nov. 2018].
En.wikipedia.org. (2018). Robert Hooke. [online] Available at: https://en.wikipedia.org/wiki/Robert_Hooke [Accessed 10 Nov. 2018].Chegg.com. (2018).
Chegg.com. [online] Available at: https://www.chegg.com/homework-help/questions-and-answers/module-2-discussion-experiment-test-hooke-s-law-imagine-alternate-universe-robert-hooke-di-q30103784 [Accessed 10 Nov. 2018].
Free Homework Help. (2018). Understanding Hooke’s Law. [online] Available at: https://schooltutoring.com/help/understanding-hookes-law/ [Accessed 10 Nov. 2018].
